
Advertising & Campaigns
Launch Google and Meta (Facebook & Instagram) campaigns from one guided setup — goal, audience, budget, creative, review, launch.
Learn moreAnalytics & Reporting
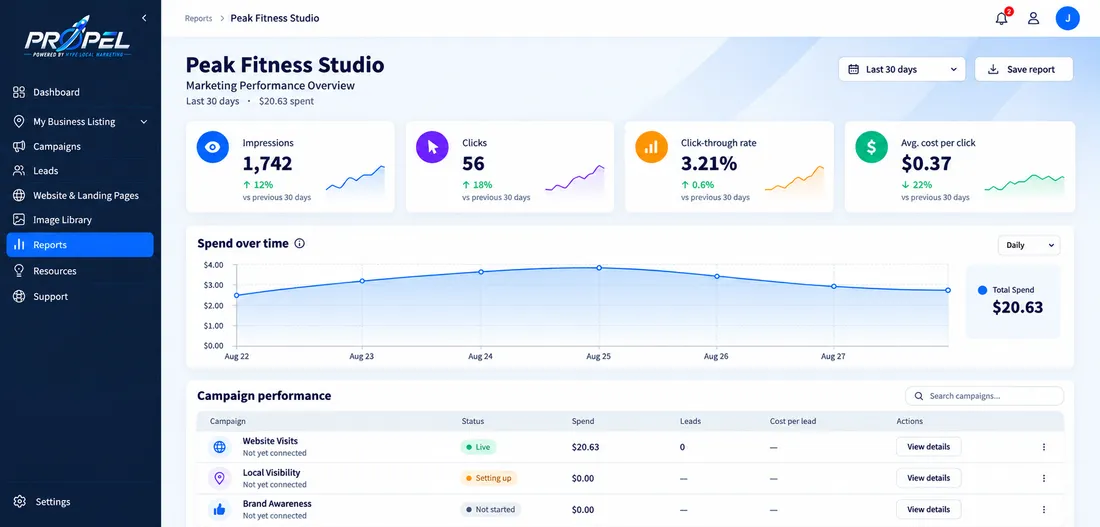
Propel brings your campaign numbers into one place and explains them simply: what you spent, what it produced, and how that compares to last period. No marketing jargon required.
What it does
Clear dashboards for impressions, clicks, calls, leads, and spend — plus downloadable reports in plain English.
Owners who want straight answers about their marketing spend.
How it works
Performance data from your connected platforms flows in automatically.
Compare periods and spot what's improving — weekly, not daily.
Adjust budgets, pause what isn't working, and double down on what is.
Connected
Launch Google and Meta (Facebook & Instagram) campaigns from one guided setup — goal, audience, budget, creative, review, launch.
Learn moreManage and optimize your Google Business Profile — profile info, reviews, posts, photos, keywords, competitors, and directory listings.
Learn moreEvery lead from every source in one pipeline — from New to Customer — with notes, history, and follow-up on each.
Learn moreStart your free trial and set up your business in minutes. No marketing experience needed.
Free trial on every plan · Card required, not charged until your trial ends · Cancel from Settings → Billing